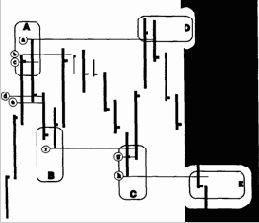
There is an understandable tendency to look to see kev horizontal support and resistance levels tested when they are reapproached. Many traders tend to set profit targets referenced to such levels, and stops also tend to be positioned relative to breaches of these levels. This is all verv well but disappointment often results as the key support and resistance levels in a structure aren't necessarily the isolated highs and lows. Thus very often the market will reverse just short of these levels, much to the fury of many traders who'd been counting the pennies before they were securely in the till! Consider the stylised bar chart in figure 1, areas (A) and (B) represent a two period reversal stmcture that is commonly seen in the markets. Taking the highlighted (A) area first, the bulls would have been well contented at the close of the period (close "C"). However, they were due for a shock, as whilst the market did push higher to begin with in the next period (sucking more weakly committed bulls in), by the close (close "D") there were a lot of unhappy and damaged traders around. The high of the first period "b" constitutes a much more potent resistance level when retested, than the actual isolated high of the structure marked "a". This is not to say that "a" won't be attacked, but time and again you'll find it's "b" where the real battle is fought, and where the subsequent reversal or
|
Vocabulary
to set targets — ńňŕâčňü öĺëč
ja fury — áĺřĺíńňâî
till — ęŕńńŕ
ë to suck in — âńŕńűâŕňü
ou 'potent - ńčëüíűé
|